
Troubleshooting Debugging Issues in Next.js Projects with VSCode
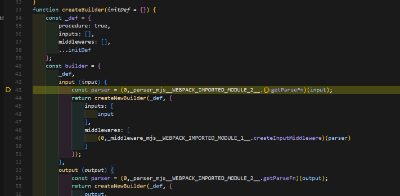
Debugging is an essential part of the development process, allowing developers to identify and fix issues in their code. However, sometimes things don't go as planned, and you might find that breakpoints in your Next.js project are not working as expected in VSCode. This blog post will explore common reasons why this might happen and provide solutions to get your debugging back on track.
Common Causes and Solutions
1. Incorrect launch.json Configuration
The .vscode/launch.json file is crucial for setting up your debugging environment. Ensure that it is correctly configured for a Next.js project. Here's a typical configuration:
Json
Example: If your program path is incorrect, VSCode won't be able to launch the Next.js server properly, leading to debugging issues.
2. Outdated VSCode or Debugger Extension
Ensure that both VSCode and any relevant debugger extensions are up to date. Outdated software can lead to compatibility issues.
Example: An older version of the Node.js debugger might not support the latest features of Next.js, causing breakpoints to fail.
3. Source Maps Configuration
Source maps are essential for mapping your TypeScript or minified JavaScript back to the original source code. Make sure sourceMaps is set to true in your configuration.
Example: Without source maps, the debugger cannot accurately map breakpoints to the correct lines in your source code.
4. Node.js Version Compatibility
Ensure that your Node.js version is compatible with your Next.js version. Incompatible versions can lead to unexpected behavior.
Example: Using a Node.js version that is too new or too old for your Next.js version might cause the debugger to malfunction.
5. Custom next.config.js Settings
If you've customized your next.config.js, ensure that these changes don't interfere with debugging.
Example: Certain Webpack configurations might prevent source maps from being generated correctly.
6. Clearing Cache
Sometimes, cached files can cause issues. Clear the Next.js cache by deleting the .next directory and restarting the server.
Bash
Example: A stale cache might cause the debugger to reference outdated code.
7. Restarting VSCode and the Development Server
A simple restart can often resolve issues. Close VSCode and your development server, then reopen them.
Example: Temporary glitches in VSCode or the server might be resolved with a restart.
8. Correct Breakpoint Placement
Ensure that breakpoints are set on executable lines of code. Changes in the code might have shifted the lines.
Example: Placing a breakpoint on a comment or an empty line will not work.
9. Debug Console Errors
Check the VSCode debug console for any error messages or warnings that might provide clues.
Example: Errors in the console might indicate misconfigurations or missing dependencies.
10. Environment Variables
Ensure that any NODE_OPTIONS or other environment variables do not conflict with the debugger.
Example: Incorrectly set environment variables might prevent the debugger from attaching properly.
11. Manual Debugging with --inspect
If all else fails, try manually starting Next.js with the --inspect flag and attach the debugger.
Bash
Example: This method can help isolate whether the issue is with VSCode or the Next.js setup.
12. Extension Conflicts
Disable other extensions that might interfere with the debugger.
Example: Extensions that modify JavaScript or TypeScript behavior might conflict with debugging.
13. Dependency Issues
Ensure all dependencies are correctly installed and up to date. Reinstall if necessary.
Bash
Example: Missing or outdated dependencies can cause runtime errors that affect debugging.
14. Operating System Permissions
Ensure you have the necessary permissions to run the debugger on your operating system.
Example: Permission issues might prevent the debugger from attaching to the process.
Conclusion
Debugging issues can be frustrating, but by systematically checking these common causes, you can often resolve the problem and get back to developing your Next.js application. If the issue persists, consider testing your setup on a different machine to rule out environment-specific problems